Forex Analysis by PipSafe

Статус
Закрыто для дальнейших ответов.

PipSafe

Новичок форума
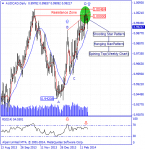
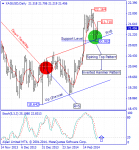
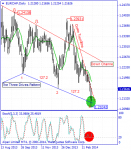
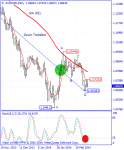
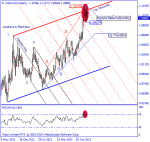
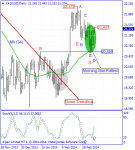
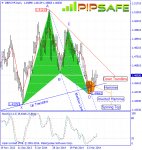
AUD/USD was in a strong and consistent downtrend during the recent months that sellers were successful in obtaining the lowest price of 0.86581. price with reaching to the supportive level which is shown in the picture below ( made of 2 bottom prices) has stopped from more descend( sellers used this level to exit their trades) and with formation of a bottom price in daily time frame has prepared a field for ascending of price.

With formation of Morning Star(with 2 stars) candlestick pattern in weekly time frame, there is a warning for Vulnerability of downtrend.Currently in weekly and daily time frames price is above 5-day moving average that warns about the potential of ascending of price during long period of time.RSI indicator in daily timeframe (also Weekly Time Frame) is in saturation sell area and also it is in divergence mode with the price chart that warns the potential for ascending of the price during the next candles.The first important warning for ascending of the price according to the technical signs is breaking of the resistance level 0.90481.

audusddaily.png
 

PipSafe

Новичок форума
Technical analysis of USDCHF dated 26.02.2014

USD/CHF was in a downtrend during the recent weeks that sellers were successful in obtaining the lowest price of 0.88513.Currently price in long term time frames such as monthly , weekly and daily is under 5-day moving average and warns more descending in long term interval.In the H4 time frame, right now, the descending trend of the price has been stopped when the price reached the blue supportive line and the it formed the third bottom price on this line. There are two candle pattern on this line, Hammer and Spining top, which are good proves of sellers’ defeat to reach the lower prices and then formation of a bottom price.

As it is obvious in the picture below, there is AB=CD harmonic pattern(also Butterfly Harmonic Pattern) with ratios of 61.8 and 127.2 between top price of 0.91561 and the bottom price of 0.88513 that warns about changing price direction from the D point of this pattern.Stoch indicator in daily time frame (also in 4H time frame) is in saturation sell area and with the next cycle warns about ascending of price during the next candles.Generally until the bottom price of 0.88513 is preserved, the price has the potential for ascending in this currency pair.

usdchfh4.png
 

PipSafe

Новичок форума
Technical analysis of AUDCAD dated 27.02.2014

AUD/CAD pair from the end of 2013 till now was in a uptrend( with price reformation )that shows buyers determination to achieve predetermined targets. Buyers were successful to achieve the highest price level of 1.00594.Currently price in daily ad h4 time frames is under 5-day moving average that shows descending of price during the net candles.As it is obvious in the picture below, there is an AB=CD harmonic pattern between the bottom price of 0.94208 and the top price of 1.00594 with Non- ideal ratios of 61.8 to 127.2 that warns about descending of price from the D point of this pattern.RSI indicator is in saturation buy area and in divergence mode with the price chart and confirms the top price and warns about changing price direction during the next candle.Generally until the top price of 1.00594 is preserved, there is a potential for descending and price reformation in this currency pair.
 

Вложения

  • audcaddaily.png
    audcaddaily.png
    28,1 КБ · Просмотры: 36

PipSafe

Новичок форума
Silver chart since the middle of 2011 till now was in a downtrend accompanied with price reformation that sellers were successful in achieving the lowest price of 18.642.Right now price is above 5-day moving average in long term time frames such as monthly and weekly that shows a consistent uptrend in long period of time. In daily time frame with formation of Inverted Hammer candlestick pattern( Also Spining Top candlestick pattern) in previous candle, there is a warning for formation of a bottom price (need to be recorded) and vulnerability of downtrend.

As it is obvious in the picture below, Price has passed the descending trend line made of 6 peak prices warns about more ascending.In monthly time frame of this currency pair, there is a Morning Star candle stick pattern (With 2 stars) that warns about the potential for formation of a bottom price and ascending of the price for buyers.Generally the first warning for ascending of price is breaking of 21.710 resistance level.
 

Вложения

  • xagusddaily.png
    xagusddaily.png
    25,3 КБ · Просмотры: 29

PipSafe

Новичок форума
EUR/CHF was in a strong and consistent descending trend that sellers during this descending trend were successful in achieving the lowest price level of 1.21043. Currently in 4H time frame with formation of Ideal Doji candlestick pattern (formation of Doji candlestick patterns which shows indecision market for ascending or descending) price has been stopped from more descending and there is a possibility of formation of a bottom price and finally ascending of the price.

According to the formed movements in Daily time frame, between the top price of 1.24138 and bottom price of 1.21043 there is Three Driver harmonic pattern with ideal ratios of 127.2 and 127.2 that by completion of the 3 point in this pattern, there is warning for ascending of the price. Stoch indicator with the ascending cycle confirms the third point of The Three Drives Pattern and warns about the potential of ascending during the next candles. Breaking the descending trend line (made of 3 resistance level) in 4H time frame is the first important warning for ascending of price in current situation. Generally until the price level of 1.21043 is preserved, price will have the potential for reformation and ascending.
 

Вложения

  • eurchfdaily.png
    eurchfdaily.png
    27,1 КБ · Просмотры: 29

PipSafe

Новичок форума
As it is obvious in the picture below, price in AUD/NZD currency pair from the end of 2011till now was in a Downtrend that Sellers have the price close to the supportive levels’ range of 1995 and 2005.Price has formed a bottom price with reaching to the specified supportive levels in the picture below and it has stopped from more descend and has started a little ascend with shows exit of some Sellers from their trades. Currently price in monthly ,Weekly and daily time frames is under 5-day moving average that shows descending of price during the net candles.

In Monthly time frame with formation of hammer candlestick pattern, there is a warning for formation of a bottom price (need to be recorded) and vulnerability of downtrend.As it is obvious in the picture below, there is a Gartley pattern between the bottom price of 1.04912 and the top price of 1.09446 that there is a potential for changing price direction from D point of this pattern.As it is obvious in the picture below, Stoch indicator is(Daily and h4) in saturation sell area and warns about ascending of the price during the next candles.Generally according to the technical signs in the price chart until the mentioned supportive levels are preserved, the price has the potential to increase and ascend.
 

Вложения

  • audnzddaily.png
    audnzddaily.png
    24,2 КБ · Просмотры: 24

PipSafe

Новичок форума
USD/CAD since 16.09.2012 was in strong and consistent Uptrend that buyers were successful in achieving the highest price level of 1.12242.The price has stopped from more ascend by reaching to the resistance edge of Up channel and a top price was created on the resistance line by the buyers retreat.Right now in daily and H4 time frames, the price is under 5-day moving average that shows the descending trend and warns about more descending.

according to the recent descend the Monthly candle in previous Month was appeared as Harami candlestick pattern that shows failure of buyers in reaching to the higher prices and formation of a bottom price in this range (closing of bearish candle).RSI indicator is in saturation buy area and confirms the current top price, also wars about formation of a top price.Generally until the mentioned top price on the resistance channel edge is preserved, the price has the potential for reformation and descending in this currency pair.
 

Вложения

  • usdcadweekly.png
    usdcadweekly.png
    25,2 КБ · Просмотры: 32

Геша5

ỔχστĦиҜ Ħ₳ ҦթტФИŢ
USD/CAD since 16.09.2012 was in strong and consistent Uptrend that buyers were successful in achieving the highest price level of 1.12242.The price has stopped from more ascend by reaching to the resistance edge of Up channel and a top price was created on the resistance line by the buyers retreat.Right now in daily and H4 time frames, the price is under 5-day moving average that shows the descending trend and warns about more descending.

according to the recent descend the Monthly candle in previous Month was appeared as Harami candlestick pattern that shows failure of buyers in reaching to the higher prices and formation of a bottom price in this range (closing of bearish candle).RSI indicator is in saturation buy area and confirms the current top price, also wars about formation of a top price.Generally until the mentioned top price on the resistance channel edge is preserved, the price has the potential for reformation and descending in this currency pair.
Вы предпологаете что это точка разворота глобального тренда?!
 

PipSafe

Новичок форума
EUR/USD in recent weeks, has been experienced many reformation with a gradual upward trend that Buyers over price increases obtained the highest price of 1.39145. As it is obvious in the picture below, Price has passed the descending trend line made of 3 peak prices and with being above 5-day moving average warns about more ascending.Currently in long-term time frames such as monthly , weekly and daily price is above the 5-day moving average which implies consistent uptrend with potential of further rise in price during the next candles.

In daily time frame of previous Candle the ideal Shooting Star candlestick pattern is seen that has long higher shadow and cause the failure of Buyers in reaching to the higher price and possibility of formation of a peak price in this range. By fixing of Shooting Star candlestick pattern’s warning (closing of descending candle at the end of the day) there is a possibility for descending of price.As it is obvious in the picture below, there is a harmonic butterfly pattern(also AB=CD Pattern) between the bottom price of 1.34788 and the top price of 1.39145 that there is a potential for changing price direction from D point of this pattern. The first warning for descending of the price in current condition is breaking of the supportive level of 1.38521.

S1=1.38521
S2=1.38235
R1=1.39145
R2=1.4000
 

Вложения

  • eurusdh4.png
    eurusdh4.png
    27,7 КБ · Просмотры: 24

PipSafe

Новичок форума
Hi
Sorry,I cant understand your mean(of course i know this forum is russian! )
about USD/CAD
There is the potential for downtrend and reform on the long-term
 

Вложения

  • usdcadmonthly.png
    usdcadmonthly.png
    38,5 КБ · Просмотры: 25

PipSafe

Новичок форума
GBP/USD since 09.07.2013 till now was in a strong and consistent uptrend that buyers were successful in achieving the highest price of 1.68168. During this price uptrend, the price has been stopped from more ascending by reaching to the area of important Resistance Zone made of 5 peak prices date back to 2009(also 2011). Right now in daily and h4 time frames, the price is under 5-day moving average that shows the descending trend and warns about more descending. Formation of Dark cloud Cover and Doji candlestick patterns in green area shows indecision market and vulnerability of ascending trend. RSI indicator is in saturation Buy area and with the next cycle confirms the top price of 1.68168 warns about price reformation during the next candles. Generally according to the formed signs until the top price of 1.68168 is preserved, price has the potential of descending.
 

Вложения

  • gbpusdweekly.png
    gbpusdweekly.png
    23,4 КБ · Просмотры: 23

PipSafe

Новичок форума
NZD/USD in recent weeks, has been experienced many reformation with a gradual upward trend that Buyers over price increases obtained the highest price of 0.85213.Currently price in long term time frames(Such as Monthly,weekly and Daily ) is above 5-day moving average and warns about more ascending in long term interval of this currency pair.Price has been stopped from more ascend by reaching to the specified resistance levels in the picture below and with exit of some buyers from their trades at the end of 7th ,10th and 11th days, the Doji , Spining Top and Shooting Star candlestick patterns have been created. These candles shows vulnerability and indecision market in ascending or descending of price that for confirmation it needs closing of a bearish candle
As it is obvious in the picture below , right now in daily time frame ABC descending pattern with the ratio of 161.8 is observable that with the completion of the D point there is a warning about down of price and descend by this pattern.The Stoch indicator is in the saturation buy area and issued the warning of the formation of top price and the falling of the price.Generally until the top price of 0.85213 is preserved, there is a potential for descending and price reformation in this currency pair.
 

PipSafe

Новичок форума
Silver chart since the middle of 2011 till now was in a downtrend accompanied with price reformation that sellers were successful in achieving the lowest price of 18.213.Right now price is above 5-day moving Daily and H4 time frames that show an uptrend during the next candles.By formation of Morning Star( With 2 Stars) candlestick pattern on 7,10,11 and 12th days in daily time frame, there is a warning(R=S) for the first failure of sellers in achieving lower prices and formation of a bottom price for increasing of the price in this area.

As it is obvious in the picture below, there is non-ideal AB=CD pattern between the top price of 22.173 and the bottom price of 20.589 that there is a potential for ceasing of price from D point of this pattern. Stoch indicator is in saturation sell area and divergence mode with the price chart that confirms the current bottom price and warns about ascending of price during the next candles. Generally until the price level of 20.589 is preserved, price will have the potential for reformation and ascending.
 

Вложения

  • xagusddaily.png
    xagusddaily.png
    24 КБ · Просмотры: 19

PipSafe

Новичок форума
As it was mentioned in the previous technical analysis of this currency pair dated 2014.03.05 , according to the formed signs, there was a potential for ascending of price which finally happened. Buyers were successful in reaching to the highest price of 1.07578 and after that the price has started to decrease.According to the formed movements in the last days , there are an Inverted Hammer candlestick pattern and Doji which shows indecision marker for ascending or descending and there is a warning for stopping of more descending.

As it is obvious in the picture below, there is a harmonic Bat pattern between the bottom price of 1.04912 and the top price of 1.09446 that there is a potential for changing price direction from D point of this pattern.Stoch indicator in Daily time frame is in saturation sell area and with the next cycle warns about ascending of price during the next candles. Generally until the bottom price of 1.05364 is preserved, price will have the potential for reformation.
 

Вложения

  • audnzddaily.png
    audnzddaily.png
    27,8 КБ · Просмотры: 18

PipSafe

Новичок форума
EUR/JPY pair from the end of 2012 till now was in a strong and without reformation uptrend that shows buyers determination to achieve predetermined targets. Price during the recent uptrend was able to record the highest price of 145.614.As it is obvious in the picture below, price has been stopped from more descending with reaching to the Up Trend line made of several Support points (Sellers leave their trades) and with creating the Bottom price of 140.296, the field has been prepared for ascending. The first warning for ascending of price is breaking of the resistance level (the yesterday highest price change) 141.947.According to the recent downfall from the top price of 143.773, RSI indicator is in saturation sell area and with the next cycle confirms the bottom price of 140.296 warns about price reformation during the next candles.One of the important warnings for starting the price downfall is breaking the ascending trend line (made of Five bottom prices) in 4H time frame.
 

Вложения

  • eurjpyh4.png
    eurjpyh4.png
    29,7 КБ · Просмотры: 20

PipSafe

Новичок форума
As it was mentioned in the previous technical analysis of Gold dated 2014.02.20 , according to the formed signs, there was a potential for ascending of price which finally happened. Buyers were successful in reaching to the highest price of 1391.908.The price by reaching to the resistance ascending Channel edge has been stopped from more ascend and by forming a Shooting Star candlestick patterns( possibility of formation of a top price and changing price direction)and fixing of it by a descending candle has prepared the field for creating a top price and a descending trend.
Right now the price is under 5-day moving average( Dilay and h4 Time frame) and surmounts the supportive level of 1325.549 that shows the possibility of more descends in this currency pair.Stoch Indicator shows ascending trend of the next candles in this time frame, but because of not being in the same direction of daily(also weekly) time frame it is not so valid. According to the current condition the first warning for descending of price is breaking of the resistance level of 1334.496.
 

Вложения

  • xauusdh4.png
    xauusdh4.png
    30 КБ · Просмотры: 18

PipSafe

Новичок форума
USD/CHF in recent weeks has been in a strong and consistent trend in the price movements which Sellers have been successful in reaching to the lowest price of 0.86991. Currently the mentioned price level is fixed as a Bottom price, and it is the most important Support level in front of the price.price with reaching to the supportive level which is shown in the picture below ( made of 5 bottom prices) and the important round level of 0.87000 has stopped from more descend( sellers used this level to exit their trades) and with formation of a bottom price in daily time frame has prepared a field for ascending of price.
Right now price in daily time frame price is above 5-day moving average and warns the potential of ascending of price during the next candles. As it is obvious in the picture below, there is butterfly pattern between the top price of 0.91568 and the bottom price of 0.86991 that there is a potential for ceasing of price from D point of this pattern.Stoch indicator in Daily time frame is in saturation sell area and with the next cycle confirms the current bottom price and warns about the potential of ascending during the next candles. In case of ascending of the price, one of the buyers target will be the Down Trendline.


USDCHF%20NEWS%202014.03.21.jpg
 

PipSafe

Новичок форума
As it was mentioned in the previous technical analysis of Silver dated 2014.03.13, according to the formed signs, there was a potential for ascending of price which finally happened. Buyers were successful in reaching to the highest price of 21.769 and after that the price has started to decrease.Currently price in Weekly , daily and h4 time frames is under 5-day moving average that shows descending of price during the net candles.As it is obvious in the picture below, there is an AB=CD harmonic pattern between the top price of 22.149 and the bottom price of 20.088 with ideal ratios of 76.4 to 127.2 that warns about descending of price from the D point of this pattern.

RSI indicator is in saturation sell area follows the bottom price of 20.088 and warns the possibility of ascend during the next candles.One of the important signs for descending is breaking of Down Trend line (made of 2 top prices). Given the current situation of price, the best confirmations for ascending and reformation of price is closing of bullish candle in Daily time frame and being of price above 5-day moving average in H4 time frame.
 

PipSafe

Новичок форума
GBP/CHF in recent weeks, has been experienced many reformation with a gradual Downtrend that Sellers Down price increases obtained the lowest price of 1.44662.it is obvious in the picture below, the price by reaching to the ascending trend line made of 2 Bottom prices has been stopped from more descending(sellers used this level to leave their trades) and the buyers are hopeful about ascending of price from this supportive level.Right now price is above 5-day moving Daily and h4 time frames that show an uptrend during the next candles.
As it is obvious in the picture below, there is a harmonic Gartley pattern between the Top price of 1.51213 and the Bottom price of 1.44662 that there is a potential for changing price direction from D point of this pattern. Stoch indicator is in saturation sell area that confirms the current bottom price and warns about ascending of price during the next candles.In case of ascending of the price, one of the buyers target will be the drawn Down Trendline .Generally until the price level of 1.44662 is preserved, price will have the potential for reformation and ascending.
 

Вложения

  • gbpchfdaily-2014.03.26.jpg
    gbpchfdaily-2014.03.26.jpg
    289,7 КБ · Просмотры: 22
Статус
Закрыто для дальнейших ответов.
Верх