Новый взгляд на рынок/ ТС A*b*o*o*n*a*c*c*i

Clair

Местный житель
14 сентября 2010 на FF начата ветка по системе *A*b*o*o*n*a*c*c*i*.
Автор называет свою систему – новым способом видения или понимания рынка.

Вы всегда слышали о Фибоначчи.
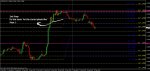
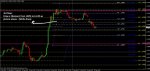
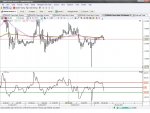
Я начну описывать систему, предложенную автором, которая рассчитывает движения пары EUR / USD.

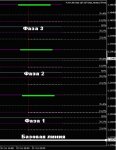
Автор исследовал пару EUR / USD и некоторые другие пары, и нашел формулу, по которой он определяет фазу движения волны и золотое сечение или базовый уровень, с которого начинается всё движение в месяце.
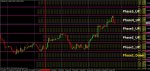
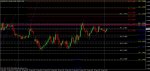
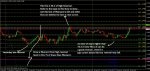
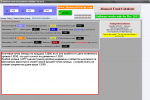
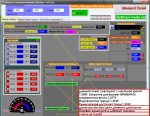
Формулу он не публикует (по понятным соображениям) а вот готовый шаблон с фазами и базовым уровнем месяца предоставляет. Так же он публикует калькулятор, с помощью которого можно рассчитывать все важные точки движения валюты на день. Калькулятор расчёта постоянно развивается и совершенствуется.
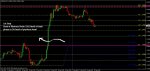
На данный момент автором представлено несколько стратегий работы с уровнями и калькулятором. Просчитаны новые закономерности движения валютной пары.

Думаю, людям, интересующимся фибоуровнями и применяющим их в торговле, будет интересно подключится к обсуждению и изучению возможностей такого взгляда на рынок.
 

Clair

Местный житель
ЧАСТЬ 1.

Все уровни Поддержки и Сопротивления создаются с первой минуты нового месяца, основываясь на предыдущем месячном диапазоне.

Каждый месяц имеет свою фазу движения волны и золотое сечение или базовый уровень, с которого начинается всё движение.

Все Уровни Фибоначчи строятся с 1 минуты нового месяца и постоянны до конца месяца.
 

Вложения

  • Месяц.GIF
    Месяц.GIF
    39,3 КБ · Просмотры: 997

Clair

Местный житель
Каждый промежуток от 0% до 100% называется Фаза

Каждая фаза имеет свои разворотные точки

Breaking points

High Reversal Point

Low Reversal Point

О том как это все построить ниже.
 

Вложения

  • 2.JPG
    2.JPG
    43,5 КБ · Просмотры: 443
  • phases.jpg
    phases.jpg
    167 КБ · Просмотры: 559
Последнее редактирование:

Clair

Местный житель
Current Phase Reversal Point
Разворотные точки текущей фазы

1 шаг

Тянем новую синюю фибо сетку с уровня 23,6 текущей фазы до уровня 50 фазы ниже (по желтой сетке)
 

Вложения

  • синяя фибо1.jpg
    синяя фибо1.jpg
    88,9 КБ · Просмотры: 708
  • Шаблон на декабрь 2011.zip
    1,6 КБ · Просмотры: 104

Clair

Местный житель
2 шаг

Тянем вторую синюю фибосетку с уровня 23,6 фазой выше до уровня 50 текущей фазы (по желтой сетке)
 

Вложения

  • синяя фибо 2.jpg
    синяя фибо 2.jpg
    97,8 КБ · Просмотры: 250

Clair

Местный житель
3 шаг

Строим белую фибо сетку - уровень 38,2 которой является лучшей разворотной точкой текущей фазы.

Тянем ее с уровня 23,6 фазы выше до уровня 61,8 второй синей сетки (см рисунок)
 

Вложения

  • белая фибо.jpg
    белая фибо.jpg
    104,5 КБ · Просмотры: 211

Clair

Местный житель
При торговле все сетки должны быть приняты во внимание.
Но следует отметить, что синие и белые фибо сетки - производные от желтой (производные от фазы месячного диапазона).
Они имеют важное значение, как уровни остановок и разворотов валюты.
 

Clair

Местный житель
HIGH REVERSAL POINT

Строим красную сетку от 50 уровня фазы выше текущей до 50 уровня первой синей сетки текущей фазы. Уровень 38,2 красной сетки и является точкой High Reversal Point. (см рисунок)

Если цена пробила эту точку то рынок пойдет выше, иначе откатит назад. (пробила у автора подразумевается прошла на 7-10 пунктов выше, общая точность уровней 2 пункта)
 

Вложения

  • красная фиба.jpg
    красная фиба.jpg
    104,6 КБ · Просмотры: 193
Последнее редактирование:

iceberg

€ $ £ ¥ ₳
Интересная тема. Надо понаблюдать за движением цены по шаблону. Определенный смысл в этом есть.
 

Clair

Местный житель
Low Reversal Point

Еще одна сетка фибоначчи которая помогает определить разворот называется автором Closing Reversal Fibonacci.

Строим зеленую сетку от 38,2 красной сетки "High Reversal Point" до 38,2 нижнего синего фибо уровня. (см рисунок).
 

Вложения

  • зеленая фиба.jpg
    зеленая фиба.jpg
    130,9 КБ · Просмотры: 253

Clair

Местный житель
На этом подготовительный этап заканчивается и начинается все самое веселое)))

Собственно сама система и ее правила.

Приведу правила на том языке на котором они выложены и попытаемся все дружно их перевести как можно более точно. Начну сама с того как я их понимаю, а Вы поправляйте или в процессе давайте более корректный перевод исходя из ситуации и понимания системы.
 

Clair

Местный житель
Rules

We have two templates that we use which are power template 3 and power template 4, each of these templates consists of phases from 0% to 100% the levels within the phases are Fibonacci levels which are 23.6, 38.2, 50.0, 76.4 and lastly 100%. We have what’s called a base line, which is a thick line that is at the 0% level of the starting phase on the first day of the new month.

The levels within each phase are Fibonacci levels and for each template as will be explained below key levels signify importance appropriate to each template. The base line however is not calculated through Fibonacci levels. The gaps between each level are shown by Fibonacci ratios however they are completely different to how standard Fibonacci ratios are used

Below is a breakdown of the contents within each template.

Power 3 Template:

The range for the phases for this template for the current month is 127 pips, this can be different for other months but as each month we are provided with a new template the range for the phases are configured with the templates. The Power 3 template is ideally used for day traders, as the range within this template is suited for this.

Power 4 Template:

The range for this template for the current month is 220 pips again as with power 3 this can be different for other months. Power 4 template is more designed towards swing trading i.e. as the phase range is quite high it’s more suited for trades over a slightly longer period.

Power 3 Template

1- The key point of our trading when we are using power 3 template is 38.2 % if this level is broken from below then price should reach 76.4% and eventually the 100% level. Now for price to continue in its upward journey price should not come back down and break the 61.8% level of the phase below, if this is broken than the immediate direction would have changed. That was for the upside now if price is heading down then the 61.8% level becomes key as this is the equivalent of the 38.2% from the other side so if this level is broken then price should reach the 23.6% level then the 0% level, however as before, this is a rule based system once price has broken the 61.8% (when we say broken we are referring to 7-10 pips) then price should not go back into the above phase and break the 38.2% level if it does then like before the immediate trend would have changed direction.

Notice:This rule is applicable only the time price is penetrating from lower phase to upper phase or when price falls down from higher phase and meets 0% level.

2- The current phase reversal point is 38.2% of white Fibonacci this applies to both Power 3 and Power 4 templates; if this level is broken then we should reach the 0% level which is the bottom of the phase. To find Current Phase Reversal deduct 8 pips from 50% level of current phase. (50% level - 8)

3- If high reversal is broken than price should not come back down below 157 pips however if price does go back up than it should not go higher than the next high reversal i.e. one phase up. An e.g. price is currently in the 3rd phase and it breaks the high reversal than price come down and breaks this level by 157 pips and it has now moved two phases down, now if price should make another surge to the upside and break the high reversal from the 3rd phase again it should not go up by more than one phase level.(Click to see an example)

4-If price moves 302 pips away from the baseline than it is said that the trend will be in that direction. So if price than turns back around and back down it should not come all the way down and break the base line. This equates to the 38.2% level of the 3rd phase i.e. price has moved 302 pips from base line. Now if the price moves 429 pips away from the base line than in either direction than price cannot come back break the trend and change its direction.( to avoid confusion please pay attention to the words " should not come " and " can not come". When it is said should not come , it means to keep a good uptrend going , the price should not come below the base line otherwise it will signal of a big drop . But when 429 pips going away from Base Line the price can not come below the base line as it has no tendency to do that and in case it happens , then this rule will be valid no more and will be omitted from the list of rules forever )

Power 4 Template


1-The same rules and principles apply. it’s just the level is different. So if price is currently below the 23.6% level then price goes through to break this we should see price reach the 61.8% level then the 76.4% and eventually the 100% level. However like with Power 3 template once price has broken the 23.6% level (when we say broken we mean 7-10 pips) then price should not come back down and break the 76.4% level of the phase below if this does happen than we can assume that the current direction in trend has changed. Now if we flip this around and price is heading down and breaks the 76.4% level from above than price should reach the 38.2% level, than the 23.6% level and eventually the 0% level. Just as we saw in the e.g. when price was coming from below if the 76.4% level is broken than price should not go back up into the higher phase and break the 23.6% level if it does than we can say that price has changed its direction.

Notice:The most important passage levels are 23.6% level and 50%-13 pips . After breaking those levels we should suppose to reach to the 0% or 100% levels.

If price is penetrating from lower phase to higher phase , then it should reach 100% after passing both levels and vice versa .

2-If price falls below the 50% level by 13 pips then we consider that level to be broken Price should go down and then reach the 0% level, the same applies for when price is moving up so if the 50% level is broken by 13 pips we consider that level to be broken and price should reach the 100% level to the top side. Again this rule only applies to power template 4. This rule can be considered as Current Reversal Point for Power 4 Template.(50% Level - 13 pips)

3-If Price passes the 50% level by 13 pips and reach the 100 % level to continue its journey price should not go back and drop below the 50% level if it does go back and break the 50% level than we can say the temporary direction in the trend has changed. The same rule applies when price is heading down so if we break the 0% level than for price to continue its journey it should not go back above and break the 50% level if it wants to continue its journey, again if this level is broken than the temporary direction in trend has changed. When we say broken we are counting price to have gone pass 13 pips beyond the 50% level.

4-If price breaks the 0% or 100% level by the 38 pips then it is considered that level is broken. So once this has happened then price should not come back and break the 50% level. What is very important to note here is for e.g. price breaks the 100 % level by 38 pips then the rule is it should not come back down and break the 50% level plus the 13 pips however if it does and then this repeats itself more than two times then from this we can ascertain that we will not have a strong trending month in fact we are likely to see a choppy range bound month.
 

Clair

Местный житель
Правила

У нас есть два шаблона, которые мы используем, power template 3 и power template 4 каждый из этих шаблонов состоит из фаз, каждая фаза состоит из уровней от 0% до 100% 23,6, 38,2, 50,0, 76,4 и, наконец, 100 %. У нас есть то, что называется базовой линией, это толстая линия, которая находится на уровне 0% в начальной фазе в первый день нового месяца.


Power 3 Template:

Диапазон фаз для этого шаблона на текущий месяц составляет 127 пунктов, диапазон может быть различным для других месяцев, но я вас обеспечиваю каждый месяц настроенным шаблоном с диапазоном фаз. Power 3 Template идеально использовать для торговли интрадей, так как диапазон, этого шаблона подходит для этого.

Power 4 Template:

Диапазон для этого шаблона на текущий месяц составляет 220 пунктов в отличие от шаблона 3, диапазон может быть различным для других месяцев. Power 4 Template более подходит для свинг трейдинга потому как фаза Диапазона достаточно высока, что больше подходит для сделок на чуть более длительный период.

Power 3 Template

1 – Для покупок ключевая точка в нашей торговле, когда мы используем power 3 template 38,2%, если этот уровень пробит снизу, то цена должна достичь 76,4% и в конечном итоге 100% уровня. Теперь о цене, чтобы сохранить свое путешествие вверх, она не должна вернуться вниз и пробить 61,8% уровень в фазе ниже, если он пробит, то данное руководство отменяется.
Это было для покупок теперь, если цена идет вниз, 61,8% уровень становится ключевым, поскольку это эквивалентно 38,2% но с другой стороны, так что если этот уровень пробит, то цена должна достичь 23,6% уровня, и в конечном итоге 0%. Однако, как и раньше, это базовое правило системы, как только цена пробила 61,8% (когда мы говорим, пробила мы имеем в виду 7-10 пунктов), то цена не должна вернуться в верхнюю фазу и пробить 38,2% уровень, если это так то тенденция изменила направление.

Примечание: Это правило применимо только в то время когда цена проникает из нижнего в верхний этап фазы или когда цена падает с высшей фазы к 0% уровню. (Полный цикл от 0 до 100 и обратно от 100 до 0)


2 - текущая разворотная точка фазы 38,2% белой Фибоначчи это относится и к Power 3 и к Power 4 templates; если этот уровень пробит, то мы должны достичь 0% уровня, который в нижней фазе. Чтобы найти Текущую разворотную точку фазы нужно вычесть 8 пунктов с 50% уровеня текущей фазы. (50%-ный уровень - 8)
 
Последнее редактирование:

Dreamer

Просто трейдер


На этом подготовительный этап заканчивается и начинается все самое веселое)))
Clair, как я понимаю, все эти построения фибо делаются в начале месяца, при получении нового шаблона и действительны на весь период!
Я прав?
 

Clair

Местный житель
Clair, как я понимаю, все эти построения фибо делаются в начале месяца, при получении нового шаблона и действительны на весь период!
Я прав?

Да, сетка постоянна на весь месяц. Просто чтобы не захламлять график синие красные белые сетки натягиваются на рабочую в данный момент фазу.

attachment.php


Шаблон по этой картинке в аналитике выкладывала.
 

redneedle

red mercury
да похоже калькулятор Боби (автор абоначи) очень даже говорит правду ... в воскресенье цена зацепила самую низкую точку прогноза Sell-зоны на месяц ... теперь осталось проверить останется ли цена под 1,3150 в этом месяце ! наверно ... да


интересная тема ... ниже 2 темплейта power 3,4 и сам калькулятор на декабрь 2011 ( уже конечно для тренировки только)


http://narod.ru/disk/35626537001/AbonacciPivot_Ver%205.3_Dec%202011%2Btpl.rar.html
 

Вложения

  • Abonacci_Dec 2011.PNG
    Abonacci_Dec 2011.PNG
    69,6 КБ · Просмотры: 237
  • pr.jpg
    pr.jpg
    95,8 КБ · Просмотры: 221
Последнее редактирование:

Dimentor-spb

Местный житель
Мне одному непонятно, с какой свечи какого таймфрейма вписывать данные в калькулятор?
 

redneedle

red mercury
Мне одному непонятно, с какой свечи какого таймфрейма вписывать данные в калькулятор?


этот выпуск калькулятора только на декабрь
в первой вкладке по денно вносим данные последнего дня HLC
в третьей на месяц будет автоматом одно и тоже в течении месяца

на январь автор выпустит новый калькулятор ... и так пока ему не надоест публицировать их ... код увы не открывает


P.S. описание 1 вкладки
 

Вложения

  • 1 вкладка.PNG
    1 вкладка.PNG
    108,8 КБ · Просмотры: 277
Последнее редактирование:
Верх