The Gartley pattern is a famous pattern for trading. The author H. M. Gartley first described it on his 1935 book Profits In The Stock Markets.
The Gartley pattern is a retracement and continuation pattern that occurs when a trend temporarily reverses direction before continuing on its original course.
It gives you a low risk opportunity to enter the market where the pattern completes and the trend resumes.
Options:
Gartley Pattern rules
Buy
Bullish Gartley pattern we have a buy arrow.
Sell
Bullish Gartley pattern we have a sell arrow.
Place your stop loss above/below the previous swing point.
Make profit at the point where price will have retraced 61.8% of the distance between A-D or wit ratio 1:2 stop loss.
Gartley pattern is often used to give trading signals.
Gartley pattern is a price action indicator and can recalculate.
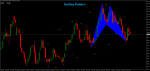
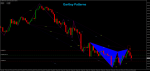
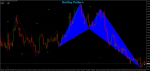
In the pictures Gartley Pattern in action


The Gartley pattern is a retracement and continuation pattern that occurs when a trend temporarily reverses direction before continuing on its original course.
It gives you a low risk opportunity to enter the market where the pattern completes and the trend resumes.
Options:
- The Gartley pattern is similar to the zig-zagging AB=CD
- pattern except that it contains an extra leg at the start.
- Fibonacci levels are used to measure the distance of these legs.
- Time Frame 15 min or higher.
- Financial markets: any.
- Gartley Patterns
- This indicator metatrader 4 is very well identified Gartley pattern.
Gartley Pattern rules
Buy
Bullish Gartley pattern we have a buy arrow.
Sell
Bullish Gartley pattern we have a sell arrow.
Place your stop loss above/below the previous swing point.
Make profit at the point where price will have retraced 61.8% of the distance between A-D or wit ratio 1:2 stop loss.
Gartley pattern is often used to give trading signals.
Gartley pattern is a price action indicator and can recalculate.
In the pictures Gartley Pattern in action