Индикаторы от verde solution, для платформы VertexFX

verde solution

Новичок форума
Dynamic Zone RSI VertexFX Indicator

The Dynamic Zone RSI is a powerful VertexFX client-side indicator based on the Relative Strength Index (RSI) and Bollinger Bands used to identify market swings.

The Relative Strength Index (RSI) indicator is useful in identifying the current trend, and its strength. When the RSI bottoms out and starts to rise it implies a bullish trend. On the contrary, when the RSI tops out and starts to fall it implies a bearish trend. The Bollinger Bands provides a trading range for the price based on standard deviation. The Dynamic Zone RSI indicator combines these two indicators to provide a composite overview of the trend.
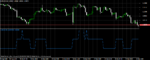
In the first step, the RSI is calculated based on the RSI period. In the second step, the Bollinger Bands of this RSI are calculated to generate the center, upper and lower RSI zones. The range between the upper and lower band is called the Dynamic Zone.
When the RSI is below the lower band, the trend is bearish. When it turns sideways oDynamic zone.pngr bottoms out, the trend now becomes neutral. When the RSI crosses above the lower band from below it is considered the start of a bullish trend.
Likewise, when the RSI is above the upper band, the trend is bullish. When it turns sideways or tops out, the trend now becomes neutral. When the RSI crosses below the upper band from above it is considered the start of a bearish trend.
Unlike RSI which provides fixed levels (eg 30/70) for entry and exit, Dynamic Zone RSI adapts the trading levels based on the price and the characteristics.
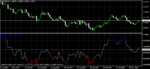
BUY / EXIT SHORT - Enter LONG (or exit SHORT) when the Dynamic Zone RSI (blue) crosses above the lower band from below.

SHORT / EXIT LONG - Enter SHORT (or exit LONG) when the Dynamic Zone RSI (blue) crosses below the upper band from above.
 

Вложения

  • Dynamic zone RSI.rar
    2,6 КБ · Просмотры: 137
Последнее редактирование модератором:

verde solution

Новичок форума
The Kirshenbaum Bands is a powerful VertexFx client-side indicator which attempts to reduce the lag and enhance the accuracy of the Bollinger Bands. It is an improvement over the Bollingers Bands and is used primarily to identify trend reversals.

One of the main disadvantages of the Bollinger Bands is that it has lag and is slow to respond to trend reversals. The standard deviation is calculated in a linear fashion - the recent price movements have the same weightage as older price movements. As a result, it is slow to respond to the recent price movements. The Kirshenbaum Bands overcomes this issue and giving a higher weightage to the recent price movements. Likewise, if uses Exponential Moving Average (EMA) as compared to the Simple Moving Average (SMA) of the Bollinger Bands. Since higher weightage is given to recent price movements, Kirshenbaum Bands responds to trend reversals quickly.
In the first step, we calculate the moving average of the specified price field (BAND_PRICE) over the recent candles (BAND_PERIOD) based on the moving average method (BAND_METHOD). By default we use Exponential Moving Average as it yields better performance.
In the second step, we calculate the standard deviation. However, instead of using equal weightage, the recent candles are assigned higher weightage. So, if the BAND_PERIOD is set to 21, then the recent error-mean is multiplied by 21, the previous one by 20 and so on. Finally, we calculate the standard deviation.
The upper band is calculated by multiplying the standard deviation with its multiplier and adding it to the moving average. Similarly, the lower band is calculated by multiplying the standard deviation with its multiplier and subtracting it from the moving average.
Compared to the Bollinger Bands, it has greater response to price movements and can identify reversals

BUY / EXIT SHORT - Enter LONG (or exit SHORT) at the close of the candle when the price closes above the lower Kirshenbaum Band (RED) from below. The stop-loss can be set to the nearest Swing Low.

SHORT / EXIT LONG - Enter SHORT (or exit LONG) at the close of the candle when the price closes below the upper Kirshenbaum Band (GREEN) from above. The stop-loss can be set to the nearest Swing Low.Kirshenbaum.png
 

Вложения

  • KirshenbaumBands.rar
    3,9 КБ · Просмотры: 69

verde solution

Новичок форума
The RMA (Relative Moving Average) is a powerful VertexFX client-side indicator based on the Simple Moving Average indicator.
The Simple Moving Average (SMA) indicator is useful to identify the start and reversal of a trend. When the price closes above the SMA it is considered bullish signal, and when it closes below the SMA it is considered bearish signal. However, one of the major drawbacks of the SMA is lag and whipsaws. The SMA is a lagging indicator, and as a result the signals are late thereby reducing profit opportunities. Similarly in sideways markets, the SMA generates whipsaws which can result in too many trades and losses. The RMA indicator attempts to remove the drawbacks of the SMA by reducing the lag period.
The RMA is calculated using three moving averages, namely long term, medium term and short term. The long term period is computed as three times the RMA_PERIOD. The medium term is computed as twice the RMA_PERIOD, and the short term is computed using the RMA_PERIOD.
We subtract the medium term SMA from the long term SMA and then add the short term SMA.
Thus, RMA = SMA (3 x PERIOD) - SMA (2 x PERIOD) + SMA (PERIOD)
The RMA reduces the lag of the SMA, by subtracting the medium term SMA and then adding the long term SMA. Any movements that occurred over the longer period are automatically filter out thereby reducing the lag.
BUY / EXIT SHORT - Enter LONG (or exit SHORT) at the close of the candle when the RMA indicator turns GREEN and the price is above the RMA indicator. The stop-loss can be set to the nearest Swing Low.

SHORT / EXIT LONG - Enter SHORT (or exit LONG) at the close of the candle when the RMA indicator turns RED and the price is below the RMA indicator. The stop-loss can be set to the nearest Swing High.RMA.png
 

Вложения

  • RMA (4).rar
    3,5 КБ · Просмотры: 94

verde solution

Новичок форума
The Trend Interruption Average (TIA) is a powerful VertexFX client-side indicator based on Moving Average useful in identifying price swings and strength of a trend.


In an uptrending market we see consecutive positive closes. Likewise, in a downtrending market we see consecutive negative closes. The TIA indicator uses the positive / negative consecutive closes to calculate the strength of the trend and potential reversal. The TIA comprises of three components, namely the TIA-Up (GREEN) line, the TIA-Down (RED) line, and the TIA-Difference (BLUE) line.
In the first step, we calculate the cumulative sum of positive closes. If the current close is above previous close, it is assigned a value of 1. If next candle closes above current close, the cumulative count is increment by 1, otherwise it is reset to 0. For example, if there were three consecutive positive closes , the value of cumulative count will be 1, 2 and 3 for the recent three candles. Similarly, the opposite logic is employed for negative closes - we calculate the cumulative sum of the negative closes separately.
In the next step, we calculate the moving average of the cumulative positive closes and negative closes using the MA_PERIOD. The moving average of the cumulative positive closes is the TIA-Up (GREEN) line, and that of the cumulative negative closes is the TIA-Up (RED) line. The TIA-Difference (BLUE) line is the difference between the TIA-Up and TIA-Down.
When the TIA-Up is rising it implies a bullish trend, whereas when the TIA-Down is rising it implies a bearish trend.
BUY / EXIT SHORT - Enter LONG (or exit SHORT) at the close of the candle when the TIA-Up (GREEN) line closes above the TIA-Down (RED) line. The stop-loss can be placed below the nearest Swing Low.

SHORT / EXIT LONG - Enter SHORT (or exit LONG) at the close of the candle when the TIA-Down (RED) line closes above the TIA-Up (GREEN) line. The stop-loss can be placed above the nearest Swing High.
 

Вложения

  • TIA.png
    TIA.png
    28,4 КБ · Просмотры: 468
  • TIA.rar
    3,1 КБ · Просмотры: 69

verde solution

Новичок форума
The Welford Variance indicator is a useful VertexFx client-side indicator for identifying trend changes on higher time-frames.

It calculates the standard deviation and variance of the price changes over the Variance Period (VAR_PERIOD), and then smoothes it using a smoothing co-efficient. The Welford Variance indicator should be used in combination with other trend-following oscillators like Relative Strength Index (RSI), Moving Average Convergence Divergence (MACD) or Stochastic Oscillator.
The standard deviation defines how much the current price is deviating from the mean price. Higher the standard deviation, greater is the volality. In the first step, we calculate the mean and standard deviation of the recent VAR_PERIOD candles. In the next step, we calculate the variance by subtracting the price from the standard deviation. Finally, we smooth the variance, using the co-efficient, which is reciprocal of (1 + VAR_PERIOD). When the variance increases, the probabilty of fast price movement in the current direction is very high. As a result the Welford Variance indicator can provide powerful trade entries with minimal lag.
BUY / EXIT SHORT - Enter LONG (or exit SHORT) at the close after the Welford Variance indicator has bottomed out and is rising, and other confirmation indicator like RSI, MACD or Stochastic Oscillator has turned bullish. The stop-loss can be set to the nearest Swing Low.

SHORT / EXIT LONG - Enter SHORT (or exit LONG) at the close after the Welford Variance indicator has peaked out and is falling, and other confirmation indicator like RSI, MACD or Stochastic Oscillator has turned bearish. The stop-loss can be set to the nearest Swing High.
 

Вложения

  • variance welford.rar
    1,9 КБ · Просмотры: 78
  • Welford.png
    Welford.png
    28,2 КБ · Просмотры: 635

Юлия

Главный редактор
Объединила ваши темы, нет смысла делать под каждый индикатор тему.
 

Sergey85

Прохиндей!
Старо как мир!!! Все это работает!!! С огрехами...
 

sapp

Местный житель
А как вы работаете с файлами с расширением *.vtl?? как вы их в MT4 засунули?
 

Indicdeveloper

Интересующийся
The MBA is a powerful VertexFX client-side indicator based on four indicators, namely MACD, RSI, Stochastic Oscillator and Momentum indicator.
Each of these indicators have specific characteristics and responds to the price changes in different ways. By combining these four indicators MBA provides a holistic view of the price movements.
The MACD and Stochastic Oscillator provide a good insight into the strength of the trend. When both of these are rising it is the sign of a strong bullish trend. When they are falling it is a sign of a strong bearish trend. When MACD and Stochastic Oscillator are moving in opposite direction it points to trend exhaustion or sideways direction. The Momentum indicator tells us how far the price has changed over the reference period. Greater the value of Momentum, stronger the trender.
The raw MBA value is calculated by multiplying the sum of MACD and RSI with the Stochastic value, and then dividing it by the Momentum. The refined MBA is then derived by computing the Simple Moving Average (SMA) of the raw MBA value.
When MBA is GREEN and rising it indicates a bullish trend. When it is YELLOW and falling it indicates a bearish trend. Since the MBA is an oscillator, bounded between 0 and 100, the crucial levels are 20 and 40. When MBA turns GREEN below 20 it is considered a good opportunity to buy, and whereas when it turns YELLOW above 40 it is considered a good opportunity to sell.

BUY / EXIT SHORT - Enter LONG (or exit SHORT) at close of candle when the MBA indictor turns GREEN below the 20 level. The stop-loss can be placed below the nearest Swing Low.

SHORT / EXIT LONG - Enter SHORT (or exit LONG) at close of candle when the MBA indicator turns YELLOW above the 40 level. The stop-loss can be placed above the nearest Swing High.
 

Вложения

  • mba.png
    mba.png
    27,3 КБ · Просмотры: 193
  • MBA.rar
    3,7 КБ · Просмотры: 46

Indicdeveloper

Интересующийся
The sRSI (Sell Relative Strength Index) is a powerful VertexFX client-side indicator based on enhanced implementation of the Relative Strength Index (RSI) indicator.
The RSI indicator is useful in identifying the trend of the strength as well as the end of the trend. However, one of the drawbacks of the sRSI is that it introduces lag. Another drawback of RSI is that since all price changes are given equal weightage the more recent price changes are not reflected quickly in the calculations. The sRSI solves this drawback by giving weightage to the more recent price changes. The traditional RSI uses only Close prices. The sRSI uses Open, High, Low and Close prices to capture not only the change in trend but also the strength of the trend within the candle.

We use two levels to identify the strength of the sRSI. The primary Neutral Zone level is used to identify sideways trend. When sRSI is inside the NEUTRAL_ZONE the trend is considered sideways. When sRSI crosses above the Neutral Zone it is considered a bullish breakout, and the trader can enter long positions in such a scenario. When the sRSI crosses below the Neutral Zone it is considered a bearish breakout, and the trader can enter short positions.
In addition to the Neutral Zone levels sRSI also provides the OverBought and Oversold Levels. When the sRSI crosses above the OverBought Level it is safe to exit the long position. Similarly, when sRSI crosses below the OverSold Level it is safe to exit the short position.

BUY / EXIT SHORT - Enter LONG (or exit SHORT) at close of candle when the sRSI indicator turns BLUE either from RED or GRAY. The stop-loss can be placed below the nearest Swing Low. Do not enter LONG if sRSI was BLUE before it turned GRAY and turned BLUE again. This ensures that we do not enter in sideways or whipsaw markets.

SHORT / EXIT LONG - Enter SHORT (or exit LONG) at close of candle when the sRSI indicator turns RED either from BLUE or GRAY. The stop-loss can be placed above the nearest Swing High. Do not enter SHORT if sRSI was RED before it turned GRAY and turned RED again. This ensures that we do not enter in sideways or whipsaw markets.
 

Вложения

  • srsi.png
    srsi.png
    26 КБ · Просмотры: 223
  • sRSI.rar
    4,1 КБ · Просмотры: 56

Indicdeveloper

Интересующийся
The WPR+CCI is a powerful VertexFX client-side indicator based on the Williams Percent Rank (WPR) and the Commodity Channel Index (CCI).
The Williams Percent Rank indicator provides insights into the current price with respect to its historical highs and lows over the specified period. Lower values of WPR suggest bearish trend and higher values of WPR indicator bullish trend. The WPR is bounded between -100 and 0.
The Commodity Channel Index (CCI) measures the price variations from its statistical mean. Traders use CCI to help identify price reversals, price extremes and trend strength. The CCI typically oscillates above and below a zero line. Normal oscillations will occur within the range of +100 and -100. Readings above +100 imply an overbought condition, while readings below -100 imply an oversold condition.
The WPR+CCI indicator uses the WPR as the primary indicator and the CCI as the filter indicator. When the WPR is rising and the CCI is above +80 the WPR+CCI indicator turns BLUE indicating a bullish trend. Traders can enter a long position when the indicator turns BLUE. When the WPR is falling and the CCI is below -80 the WPR+CCI indicator turns RED indicating a bearish trend. Traders can enter a short position when the indicator turns RED.


BUY / EXIT SHORT - Enter LONG (or exit SHORT) at close of candle when the indicator turns BLUE. The stop-loss can be placed below the nearest Swing Low.

SHORT / EXIT LONG - Enter SHORT (or exit LONG) at close of candle when the indicator turns RED. The stop-loss can be placed above the nearest Swing High.
 

Вложения

  • wpr.png
    wpr.png
    26,3 КБ · Просмотры: 229
  • WPR+CCI.rar
    3,8 КБ · Просмотры: 59

Indicdeveloper

Интересующийся
The Volatility Ratio is a powerful VertexFX client-side indicator based Volatility and trend reversal.

Volatility is a measure of fast market movements. When volatility increases the markets are moving fast and making big ranges. However, we cannot predict the direction of the market based on the volatility. The Volatility Ratio (VR) determines the direction and the end of the trend thus providing a valuable tool to traders.

When VR is above 1 it indicates a bullish trend, and similarly when VR is below 1 it indicates bearish trend. By waiting for the bullish and bearish trends to top out and bottom out respectively traders can exit at the earliest their LONG and SHORT positions respectively.

BUY / EXIT SHORT - Enter LONG (or exit SHORT) when the Volatility Ratio is RED and bottoms out. The stop-loss can be placed below the nearest Swing Low. Use short term EMA to ensure that current price is above the EMA.
SHORT / EXIT LONG - Enter SHORT (or exit LONG) when the Volatility Ratio is BLUE and tops out. The stop-loss can be placed above the nearest Swing High. Use short term EMA to ensure that current price is below the EMA. volatility.png
 

Indicdeveloper

Интересующийся
The Simple Decycler Oscillator is a powerful VertexFx client-side indicator that identifies the start and reversal of a trend.

One of the major drawbacks of conventional indicators is that the signals have lag resulting in delayed trade entries. The Simple Decycler Oscillator attempts to reduce the lag by using two oscillators.
The indicator comprises of two components, the fast oscillator identified by the BLUE line and the slow oscillator identified by the RED line. The fast component is calculated using the FAST_PERIOD and the FAST_K co-efficient. Similarly, the slow component is calculated using the SLOW_PERIOD and the SLOW_K co-efficient.
The components are calculated using cycle analysis theory. The strength of the trend is calculated using a high-pass filter over the specified period and smoothed with the smoothing co-efficient (K).
The difference between the BLUE and the RED line indicates the direction of the current trend. When the BLUE line is above the RED line the trend is considered bullish and when it is below the RED line the trend is considered bearish.

BUY / EXIT SHORT - Enter LONG (or exit SHORT) at the close of candle when the fast (BLUE) line closes above the slow (RED) line. The stop-loss can be placed below the nearest Swing Low.
SHORT / EXIT LONG - Enter SHORT (or exit LONG) at the close of candle when the fast (BLUE) line closes below the slow (RED) line. The stop-loss can be placed above the nearest Swing High.Simple desc.png
 

Indicdeveloper

Интересующийся
is an innovative VertexFX client-side indicator based on Moving Average and Commodity Channel Index indicators.

The Commodity Channel Index (CCI) provides valuable insight of the current trend. However since the CCI is not bounded it tends to generate the signals too early or too late. The CCIinMA indicator overcomes this drawback by using a short period Moving Average (MA).

We calculate the Moving Average based on the MA_PERIOD and the MA_METHOD. The user can choose Simple (SMA), Exponential (EMA) or Weighted Moving Average (WMA). In the second step the CCI is calculated based on the CCI period. The CCI_LEVEL_UP defines the bullish breakout level and the CCI_LEVEL_DOWN defines the bearish breakout level. The indicator is plotted BLUE when the CCI is above the CCI_LEVEL_UP and RED when the CCI is below the CCI_LEVEL_DOWN. BLUE color indicates bullish trend, RED indicates a bearish trend.

BUY / EXIT SHORT - Enter LONG (or exit SHORT) at the close of candle when indicator color turns BLUE. The stop-loss can be placed below the nearest Swing Low. Do not place LONG trades if the indicator color is BLUE but the indicator is falling.
SHORT / EXIT LONG - Enter SHORT (or exit LONG) at the close of candle when indicator color turns RED. The stop-loss can be placed above the nearest Swing High. Don not place SHORT trades if the indicator color is RED but the indicator is rising. ccin.png
 

Indicdeveloper

Интересующийся
is a powerful VertexFX client-side indicator based on the Moving Average Convergence Divergence (MACD) indicator.

The Moving Average Convergence Divergence (MACD) indicator is provides information about the current trend and its strength. When the MACD bottoms out and starts rising it implies the market is in bullish mode, whereas when it tops out and starts falling it implies that the market is in bearish mode. However, one of the drawbacks of the MACD indicator is that it introduces lag and introduces whipsaws when the market turns sideways. The primary reason for the lag is the use of Simple Moving Average (SMA) in the calculation of the MACD.
The MACD OSMAX indicator overcomes the drawbacks of the MACD indicator by using Exponential Moving Average (EMA) instead of SMA. In addition to using the EMA, it also uses a weightage co-efficient OSMAX to give more weightage to the recent signal.
In the first step we calculate the EMA of the PERIOD_FAST and the PERIOD_SLOW. The MACD is calculated by subtracting the slower EMA from the faster EMA. The MACD signal is derived by computing the EMA of the MACD using the PERIOD_SIGNAL. Finally the OSMAX is calculated by subtracting the Signal from the MACD and multiplying it by the OSMAX co-efficient. The OSMAX is plotted as an histogram.
When both the OSMAX and MACD are rising the histogram is plotted BLUE. When both OSMAX and MACD are falling the histogram is plotted RED. The histogram is plotted GRAY when OSMAX and MACD are diverging. When the OSMAX turns BLUE from RED or GRAY it implies that the trend has turned bullish. Likewise, when the OSMAX turns RED from BLUE or GRAY it implies the trend is bearish. It has been studied that OSMAX generates better results when traders enter LONG when OSMAX turns BLUE below the zero level, and enter SHORT when OSMAX turns RED above the zero level.
As compared to the standard MACD, the MACD OSMAX indicator reduces the lag and responds to price movements quickly, thus enabling the trader to enter trades earlier and exit trades before it is too late.

BUY / EXIT SHORT - Enter LONG (or exit SHORT) at the close of the candle when the indicator histogram turns BLUE below the zero level either from RED or GRAY. The stop-loss can be placed below the nearest Swing Low.
SHORT / EXIT LONG - Enter SHORT (or exit LONG) at the close of the candle when the indicator histogram turns RED above the zero level either from BLUE or GRAY. The stop-loss can be placed above the nearest Swing High. macdosmax.png
 

Indicdeveloper

Интересующийся
The CamarillaFlatAndClear is an innovative VertexFX client-side indicator based on daily pivot and Camarilla levels.

Pivot levels are an useful tool to identify key support and resistance levels. However, they have outlived their purpose especially for short-term traders.
The CamirillaFlatAndClear indicator is an improvement of the pivot levels and Camarilla levels using "squares of 12" method.

The indicator provides seven key levels - namely the central Pivot level (YELLOW), three support (RED) and resistance (GREEN) levels each. Unlike traditional pivot level trading methods, the levels provided by this indicator act as breakout levels. Short term traders prefer to trade in the direction of the level (breakout) rather than against it (reversal). When used with short-term Exponential Moving Average (EMA) it provides excellent breakout trades for short term traders.
The central pivot level (YELLOW) is the average of the previous Day's High, Low and Close. The other levels are calculated from "squares of 12" method, whereby the previous day's range is divided by 12, 6 and 2 respectively. The resistance (GREEN) levels signify resistance. However, when the price is trending upwards alongwith the EMA, these levels act as bullish breakout levels. The support (RED) levels signify support. When the price is trending downwards alongwith the EMA, these levels act as bearish breakout levels.

BUY / EXIT SHORT - Enter LONG (or exit SHORT) when the price crosses above the GREEN Camarilla levels from below and the price is above the Exponential Moving Average. The stop-loss can be placed below the nearest Swing Low. Traders should employ a trailing stop when the position is in profit.
SHORT / EXIT LONG - Enter SHORT (or exit LONG) when the price crosses below the RED Camarilla levels from above and the price is below the Exponential Moving Average. The stop-loss can be placed below the nearest Swing High. A trailing stop should be employed to ensure profitable positions are protected.
 

Вложения

  • camarilla flat.png
    camarilla flat.png
    34,8 КБ · Просмотры: 74

Indicdeveloper

Интересующийся
RSIofPSAR VertexFX Indicator

RSIofPSAR is a VertexFX indicator that identifies trend reversals, it is based on two underlying indicators namely the Parabolic Stop-And-Reverse (PSAR) and the Relative Strength Index (RSI).

The PSAR indicator is very useful in trend-following techniques when the trend is clear. However, it leads to whipsaws in sideways markets leading to losses. The RSI indicator is useful in identifying trend reversals and sideways markets. RSIofPSAR is created by combining these characteristics from the two indicators providing use with a composite indicator the identifies trend reversals.
In the first step, we calculate the Parabolic Stop-And-Reverse (PSAR) of the price series. In the next step, we calculate the Relative Strength Index (RSI) of the PSAR calculated in the previous step. Instead of calculating the RSI using the standard technique, we use a smoothing co-efficient to eliminate the lag.

The RSIofPSAR is a bounded oscillator ranging between 0 and 100. It turns BLUE when it is rising and turns RED when it is falling.

BUY / EXIT SHORT - Enter LONG (or exit SHORT) when the RSIofPSAR turns BLUE from RED below the 50 level. Place the stop-loss below the nearest Swing Low. It is recommended to employ a trailing stop when the trade turns profitable.

SHORT / EXIT LONG - Enter SHORT (or exit LONG) when the RSIofPSAR turns RED from BLUE above the 50 level. Place the stop-loss above the nearest Swing High. It is recommended to employ a trailing stop when the trade turns profitable. 1 rsi.png
 

Вложения

  • 1- RSIofPSAR.zip
    3,6 КБ · Просмотры: 66

Indicdeveloper

Интересующийся
iDoubleChannel VertexFX Indicator

iDoubleChannel is a powerful VertexFX indicator that closely follows the price trends. The indicator comprises three components, namely the Upper (BLUE) trend, the Lower (RED) trend, and the Center (YELLOW) trend.

When the Lower (RED) component is above the Upper (BLUE) component it signals a bullish trend. Likewise, when the Upper (BLUE) component is above the Lower (RED) component it signals a bearish trend. Traders should avoid trading against the trend. The Center (YELLOW) trend provides a guideline to the price movement. When the Center trend is between the Upper and Lower trends it implies a continuation of the trend. When the Center trend deviates outside the Upper and Lower trend it signals the end of a trend and the probability of a trend reversal is very high. The Center trend is the Simple Moving Average (SMA) of the Close over the recent CHANNEL_PERIOD candles. The Upper trend is calculated from the cumulative sum of the High and difference between the High and Close over the CHANNEL_PERIOD. Likewise, the Lower trend is calculated from the cumulative sum of the Low and the difference between the Low and Close over the CHANNEL_PERIOD.

One of the main advantages of the iDoubleChannel indicator over other indicators is that it reduces the lag.

BUY / EXIT SHORT - Enter LONG (or exit SHORT) when the BUY arrow is displayed and the RED (Upper) component of the iDoubleChannel indicator is above the BLUE (Lower) component of the indicator. Place the stop-loss below the nearest Swing Low. It is recommended to employ a trailing stop when the trade turns profitable.

SHORT / EXIT LONG - Enter SHORT (or exit LONG) when the SELL arrow is displayed and the BLUE (Upper) component of the iDoubleChannel indicator is above the RED (Lower) component of the indicator. Please the stop-loss above the nearest Swing High. It is recommended to employ a trailing stop when the trade turns profitable.
2 idc.png
 

Вложения

  • 2- I DoubleChannel.zip
    3,6 КБ · Просмотры: 40

Indicdeveloper

Интересующийся
Double Smoothed AMA

Double Smoothed Adaptive Moving Average (DSAMA) is a VertexFX indicator based on the Simple Moving Average (SMA) indicator. One of the biggest drawbacks of the SMA is the presence of lag which delays trade entries and exits. The DSAMA indicator offers three advantages of the SMA indicator. First and foremost, unlike the fixed period of the SMA, the period of the DSAMA is adaptive and is calculated based on a fast and slow period range. As a result, it shows a better response than normal SMA. Secondly, by using a smoothing algorithm, the lag is reduced thereby allowing traders to enter and exit trades faster before the price has moved too far away.

Building the Indicator:

In the first step, we calculate the greatest and smallest value of the price over the recent PERIOD candles. Based on the greatest, smallest, and the current value, the smoothing coefficient is calculated. Finally, the two levels of smoothing are applied, one using the FAST_PERIOD and then using the SLOW_PERIOD to reduce the lag.
The DSAMA comprises of the BLUE (bullish) and the RED (bearish) components. When the DSAMA is rising, the indicator is BLUE and when it is falling it turns RED.

BUY / EXIT SHORT - Enter LONG (or exit SHORT) when the indicator turns BLUE from RED color. Place the stop-loss below the nearest Swing Low. It is recommended to employ a trailing stop when the trade turns profitable.

SHORT / EXIT LONG - Enter SHORT (or exit LONG) when the Double Smoothed AMA indicator turns RED from BLUE color. Place the stop-loss above the nearest Swing High. It is recommended to employ a trailing stop when the trade turns profitable.
 

Вложения

  • 3 double smoothed.png
    3 double smoothed.png
    55,6 КБ · Просмотры: 128
  • 3 double smoothed.zip
    3,5 КБ · Просмотры: 37
Верх