RSI Price Action Strategy is a trading system based on support and resistance lines.
RSI signals are filtered by slow stochastic and support and resistance lines. The purpose of this trading strategy is to make this profitable trading strategy easier. The inclusion of slow stochastics should help to make this price action strategy easier. This trading strategy is also for trading on binary options high/low.
Options:
Buy
In the folder there are other support and resistance mq4 indicators.
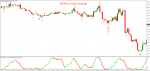
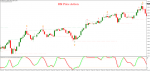
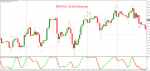
In the pictures RSI Price Action Strategy


RSI signals are filtered by slow stochastic and support and resistance lines. The purpose of this trading strategy is to make this profitable trading strategy easier. The inclusion of slow stochastics should help to make this price action strategy easier. This trading strategy is also for trading on binary options high/low.
Options:
- Expiry time 2-3 candles
- Time frame 1 min or higher.
- Currency pairs: majors, minors, indicies and stocks.
- Support and resistance lines,
- RSI OS OB alerts (3 period with levels 10, 90),
- Slow Stochastic oscillator (11, 3, 3).
Buy
- When It is formed the support line with two dots wait the RSI buy signal filtered by slow stochastic green line.
- Stop loss 3 -5 pips below support line.
- Profit target ratio 1:1 stop loss.
- When It is formed the resistance line line with two dots wait the RSI sell signal filtered by slow stochastic red line.
- Stop loss 3 -5 pips below support line.
- Profit target ratio 1:1 stop loss.
In the folder there are other support and resistance mq4 indicators.
In the pictures RSI Price Action Strategy
")