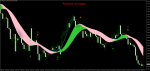
Rainbow Averages Strategy is a pure trend following strategy for trading based on rainbow averages indicator that is a system of filter in trend. In this case the averages rainbow indicator is green for uptrend and pink for down trend. Other indicators for this strategy are buzzer and step ma arrow.
Find the pairs in trend. In side markets there may be false signals.
Options:
Buy


Download Strategy
Find the pairs in trend. In side markets there may be false signals.
Options:
- Time frame 30 min or higher.
- Currency pairs: majors and minors.
- Averages rainbow (26, 2, 10, 9).
- Step one (25, 2.5, 0.5, 50).
- Buzzer (period 20).
Buy
- Price above the rainbow.
- Step one buy arrow.
- Averages rainbow green color
- Buzzer blue line (optional).
- Place initial stop loss on the previous swing low.
- Exit at the opposite arrow or with predetermined profit target tha depends by currency pairs and time frame.
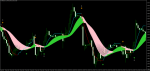
- Price below the rainbow.
- Step one sell arrow.
- Averages rainbow pink color
- Buzzer red line (optional).
- Place initial stop loss on the previous swing high.
- Exit at the opposite arrow or with predetermined profit target tha depends by currency pairs and time frame.
Download Strategy