Forex Analysis by PipSafe

Статус
Закрыто для дальнейших ответов.

PipSafe

Новичок форума
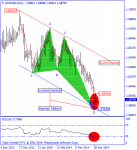
EUR/CAD was in a strong and consistent uptrend during the recent months that buyers were successful in achieving the highest price of 1.55813.Price is going toward the support level of 1.52000 (the important psychic level of Sellers) and there is not any clear reason of buy signal in long term time frames such as Weekly and daily.

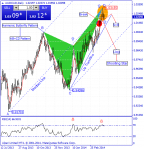
Right now in Daily and 4H time frames price is under 5-day moving average which shows consistent descending trend. According to the formed movements in the previous week, there is a Spining Top candlestick pattern which shows indecision marker for ascending or descending and there is a warning for stopping of more descending.

RSI indicator in weekly time frame is in saturation Buy area(also divergence mode in Daily time frame) that confirms the current Top price and warns about changing price direction. Generally until the price level of 1.55813 is preserved, price will have the potential for reformation and descending.
 

PipSafe

Новичок форума
As it was mentioned in the previous technical analysis of this currency pair dated 2014.03.17, according to the formed signs, there was a potential for ascending of price which finally happened. Buyers were successful in reaching to the highest price of 1.07382 and after that the price has started to decrease. Currently price in H4 and H1 time frames is under 5-day moving average that shows descending of price during the net candles.

As it is obvious in the picture below, price has been stopped from more ascending with reaching to the Down Trendline made of several resistance points (buyers leave their trades) and with creating the top price of 1.07382, the field has been prepared for descending.

As it was mentioned in the previous technical analysis of this currency, in long period of time there is good potential for growth of price but According to the current situation there is not any clear reason about ascending of price in H4 and Daily time frames. The least sign for ascending of price is formation of a bottom price and recording of it in H4 time frame
 

PipSafe

Новичок форума
AUD/CAD during the recent week was in a strong and consistent uptrend that buyers were successful in achieving the highest price of 1.03155. Right now price in long time frames such as monthly, weekly and daily is above 5-day moving average and warns about price increase in long period of time. Price has been stopped from more ascend by reaching to the specified resistance levels(Support=Resistance) in the picture below and with exit of some buyers from their trades at the end of 26th and 28th days, the Shooting Star and Hanging Man candlestick patterns have been created. These candles shows vulnerability and indecision market in ascending or descending of price that for confirmation it needs closing of a bearish candle.

As it is obvious in the picture below between the bottom price of 0.91701 and the top price of 1.03155, there is a AB=CD harmonic pattern with the ratios of 61.8 and 127.2 that with completion of the D point (also formation of butterfly pattern in CD wave), there is a potential for descending of price.RSI indicator is in saturation Buy area and divergence mode with the price chart that confirms the current Top price and warns about descending of price during the next candles.One of the important warnings for decreasing of is breaking of supportive level of 1.01809 (Low level of price changes in the previous daily candle).
 

Вложения

  • audcaddaily.png
    audcaddaily.png
    35,8 КБ · Просмотры: 23

PipSafe

Новичок форума
EUR/NZD in recent weeks has been in a strong and consistent trend in the price movements which Sellers have been successful in reaching to the lowest price of 1.57654. Currently the mentioned price level is fixed as a bottom price, and it is the most important Support level in front of the price.Currently price in long term time frames like monthly, weekly and daily time frames is under 5 day moving average which shows a consistent descending trend in long period of time.Price has been stopped from more descending with reaching to the supportive edge of Up Channel technical pattern (sellers use this lever to exit their trades) and starts to ascend.

In the range of formed bottom price there are Hammer and inverted Hammer candlestick pattern that shows the possibility for formation of a successful bottom price in continuing ascending trend.As it is obvious in the picture below, there is a harmonic butterfly pattern between the top price of 1.69937 and the bottom price of 1.57654 that there is a potential for changing price direction from D point of this pattern. RSI indicator is in saturation sell area and divergence mode with the price chart that confirms the current bottom price and warns about ascending of price during the next candles.According to the current condition the first warning for ascending of price is breaking of the resistance level of 1.59591.
 

Вложения

  • eurnzddaily.png
    eurnzddaily.png
    25,5 КБ · Просмотры: 14

PipSafe

Новичок форума
As it was mentioned in the previous technical analysis of this currency pair dated 2014.02.25, according to the formed signs, there was a potential for ascending of price which finally happened.Buyers were successful in achieving the highest price of 0.93006.Right now in daily and H4 time frames, the price is under 5-day moving average that shows the descending trend and warns about more descending.Price stopped by reaching to the important resistance level of 0.93000 and after trying to break this resistance level twice that was unsuccessful, the price created a top price under that level.

Currently in daily time frame with formation of Shooting Star(also doji) candlestick pattern (the failure of buyers in reaching to the lower prices) price has been stopped from more ascending and there is a possibility of formation of a top price and finally descending of the price.As it is obvious in the picture below, there is an AB=CD harmonic pattern between the bottom price of 0.86595 and the top price of 0.93006 with ideal ratios of 38.2 to 224.2 that warns about descending of price from the D point of this pattern. RSI indicator is in saturation buy area and confirms the current top price, also wars about formation of a top price. Generally until the top price of 0.93006 is preserved, price has the potential of descending.


audusddaily%202014.04.03.jpg
 

PipSafe

Новичок форума
EUR/USD during the recent days was in a Downtrend that Sellers were successful in achieving the highest price of 1.36727.Price by reaching to the Up Trendline (made of 2 bottom price) was not able to descend and break it in daily time frame and by creating the hammer candlestick pattern on this line shows recessing of sellers in reaching to the lower price and also the supportive level of 1.36413.

As it is obvious in the picture below between the top price of 1.38749 and the bottom price of 1.36727, there is an non-ideal AB=CD harmonic pattern with the ratios of 61.8 and 127.2 that with completion of the D point , there is a potential for ascending of price.Stoch indicator in Daily time frame is in saturation sell area and with the next cycle confirms the current bottom price and warns about the potential of ascending during the next candles.Generally until the price level of 1.36727 is preserved, price will have the potential for reformation and ascending.


eurusddaily-2014.04.08.jpg
 

PipSafe

Новичок форума
As it was mentioned in the previous technical analysis of USD/CHF dated 2014.03.21, according to the formed signs, there was a potential for ascending of price which finally happened.Buyers were successful in reaching to the highest price of 0.89525 and after that the price has started to decrease.Right now price is over 5-day moving average in Weekly time frame and warns(in long period of time)about more ascend.

The price by reaching to the long term(Daily Time frame) down trend line ( made of 2 peak prices)dated back to the 2013 has been stopped and the buyers were unable to pass this resistance line.Formation of Hammer and Spining Top candlestick patterns with thin body in green area shows indecision market and vulnerability of descending trend.RSI indicator in H1 time frame is in saturation sell area and with the next cycle warns about ascending of price during the next candles, but because of lack of coordination with the daily time frame is not much valid.According to the current condition the first warning for Ascending of price is breaking of the resistance level of 0.88459. According to the current situation there is not any clear reason about Ascending of price in short term time frames. The least sign for ascending of price is formation of a bottom price and recording of it in H4 time frame.


usdchfh1%20%20%20%202014.04.09.jpg
 

PipSafe

Новичок форума
As it was mentioned in the previous technical analysis of GBP/USD pair dated 2014.03.11, according to the formed technical signs, there was the potential for descending of price which finally happened.Sellers were successful in achieving the lowest level of 1.64661.Right now price is above 5-day moving Daily and H4 time frames that show an uptrend during the next candles.Price has formed a Top price with reaching to the specified resistance zone in the picture below and it has stopped from more ascend and has started a little descend with shows exit of some buyers from their trades.

According to the formed price movements in the chart, between the bottom price of 1.64661 and top price of 1.68209 ,there is AB=CD harmonic pattern with ideal ratios of 61.8 and 161.8 that with completion of the D point there will be a warning for descending of price.RSI indicator in H4 time frame is in saturation Buy area that confirms the current top price and warns about changing price direction.Generally until the top price of 1.68209 is preserved, price has the potential of descending. Currently the first sign for buyers is breaking of the D point of harmonic pattern in the price chart.
 

PipSafe

Новичок форума
USD/CHF since 29.07.2012 till now was in a downtrend that sellers were successful in achieving the lowest price of 0.86973. Price during the downfall with reaching to the important supportive level (0.87000) has stopped from more descend and has formed a bottom price in the level of 0.88358.Right now price is above 5-day moving daily time frame that show an uptrend during the next candles.
Currently in long term time frames such as monthly, and weekly , there is not a clear reason for price downfall and also in long period of time there is the possibility of growth of price to the Fibonacci levels of 38.2 in the level of 0.91200 and for the next time to 50% in the level of 0.92600.

As it is obvious in the picture below between the top price of 0.99692 and the bottom price of 0.86973, there is an ideal AB=CD harmonic pattern with the ratios of 78.6 and 127.2 that with completion of the D point (also formation of butterfly pattern in CD wave), there is a potential for ascending of price.Currently according to the condition of this currency pair and its strong downtrend in recent months, price is in saturation sell area and warns about a slight reformation in weekly time frame.


usdchfweekly.jpg
 

PipSafe

Новичок форума
GBP/NZD was in a strong and consistent uptrend during the recent days that buyers were successful in obtaining the highest price of 1.96327. price with reaching to the Down Trendline which is shown in the picture below ( made of 2 Top prices) and the important Resistance level(Support to Resistance) of 1.96327 has stopped from more ascend( Buyers used this level to exit their trades) and with formation of a top price in daily time frame has prepared a field for descending of price.

According to the previous day changes, previous day candle was closed as Spining Top candlestick pattern which shows vulnerability of ascending trend and potential for formation of a Top price in this range.As it is obvious in the picture below, between the Bottom of 1.90822 and Top price of 1.96327 there is AB=CD harmonic pattern with ratios of 61.8 and 127.2 that warns the potential of descending from the D point of this pattern.Generally until the D point in daily time frame is preserved, there is a potential for price reformation and descending.

gbpnzddaily.jpg
 

PipSafe

Новичок форума
EUR/GBP in recent days, has been experienced many reformation with a gradual down trend that Sellers down price Reduced obtained the lowest price of 0.81977.As it is obvious in the picture below, price during the descending has touched the Up trendline (made of 2 bottom prices) and also the round supportive level of 0.82000(some sellers used these levels to leave their trades). and has created the Harami candlestick pattern. Closing of the bullish candle after this pattern will confirm it and warns about ascending of price.

Right now price is over 5-day moving average in H4 and H1 time frames and warns about more ascend. Stoch indicator is in saturation sell area and divergence mode with the price chart that confirms the current bottom price and warns about descending of price during the next candles.Generally until the price level of 0.81977 is preserved, price will have the potential for reformation and ascending.


eurgbph4.jpg
 

PipSafe

Новичок форума
EUR/AUD chart has experienced a descending trend during the recent week that could record the bottom price of 1.46553. One of the sellers’ targets was the level of 127.2 (AB=CD Pattern) that they were successful in reaching to it and the price was not able to descend more by reaching to this level. Right now this price level is one of the important supportive levels in front of the price.

Right now price is above 5-day moving daily time frame that show an uptrend during the next candles.Formation of Shooting Star and Hanging Man candlestick patterns with thin body in green area shows indecision market and vulnerability of ascending trend.AS it is obvious in the picture below, there is an non-ideal AB=CD harmonic pattern between the top price of 1.58246 and the bottom price of 1.46553 with ratios of 61.8 and 127.2 that warns the ascending of price from the D point( the first warning for ascending is breaking of the resistance level of 1.49650). Stoch indicator is in saturation sell area that confirms the current harmonic pattern with the next cycle but because of non-compliance and coordination with larger time frame(Monthly Time frame), this signal is not much valid. The first warning in this currency pair for descending of price is breaking of the supportive level of 1.46553.


euraudweekly.jpg
 

PipSafe

Новичок форума
Gold from the top price of 1392.716 till now was in a downtrend that Sellers were able to achieve the lowest price of 1268.477.As it is obvious in the picture below, price during the descending has touched the Support Level of 1277.658 and has created the hammer candlestick pattern. Formation of the lower long shadow(Hammer Pattern) in the last week candle shows the failure of Sellers in reaching to the lower prices. Closing of the bullish candle after this pattern will confirm it and warns about ascending of price.

Right now price is above 5-day moving Monthly and daily time frames that show an uptrend during the next candles.Currently the first warning for increasing of price is breaking of the resistance level of 1306.402. Stoch indicator in weekly time frames in saturation sell area and with the next cycle warns about ascending of price(also monthly) during the next candles. Generally until the bottom price of 1268.477 is preserved, price will have the potential for ascending and reformation.


gold-2014.04.jpg
 

PipSafe

Новичок форума
AUD/USD during the recent week was in a Down trend that sellers were successful in achieving the lowest price of 0.92273. Currently in daily time frame price with touching the ascending trend line (made of 4 price levels) and forming a bottom price has prepared a field for ascending. (sellers used this level to leave their trades).Right now price in short time frames such as H4 and H1 is above 5-day moving average and warns about price increase in short period of time.

As it is obvious in the picture below, between the top price of 0.94600 and bottom price of 0.92273 there is AB=CD harmonic pattern with ratios of 38.2% and 224% that warns the potential of ascending from the D point of this pattern.Stoch indication in Daily and H4 time frame is in saturation sell area and with the next cycle confirms the 5th point of ascending trend line and warns about ascending during the next candles. Generally according to the current situation, until the bottom price of 0.92273 is preserved, price has the potential for reformation of downtrend.

WFDF-AUDUSD.jpg
 

PipSafe

Новичок форума
EUR/USD has experienced a Uptrend during the recent month that the buyers were successful in achieving the lowest price of 1.39672.Right now price is above 5-day moving average in long term time frames such as monthly, weekly and daily that shows a consistent Uptrend in long period of time.Price during the downfall with reaching to the Up Trendline( with several bottom price) has stopped from more descend and has formed a bottom price in the level of 1.37744.

If price rises and buyers success one of the price targets would be alterant level of 1.39000(or red resistance level)According to the condition of this currency pair, there is no clear reason for descend. There is formation of recursive candle patterns or one descending candle in daily chart which is the least acceptable sign for price reformation.

  • S1: 1.38512
  • S2: 1.37900
  • R1:1.39000
  • R2: 1.39400
 

PipSafe

Новичок форума
Silver chart has experienced a strong descending trend during the recent week that could record the bottom price of 18.857. One of the sellers’ targets was the round level of 19.000 that they were successful in reaching to it and the price was not able to descend more by reaching to this level.

As it is obvious in the picture below, price during the descending has touched the Up Trendline (made of 3 bottom prices) and also the round supportive level of 19.000 has created the hammer candlestick pattern. Closing of the bullish candle (Engulfing Pattern) after this pattern will confirm it and warns about ascending of price .Currently price in Daily and H4 time frames is above 5-day moving average that shows ascending of price during the next candles.RSI indicator in Daily time frame is in saturation sell area and with the next cycle warns about ascending of price during the next candles .Generally until the mentioned bottom price is preserved, there is the potential for downtrend reformation.


2014.05.05%20silver.png
 

PipSafe

Новичок форума
USD/JPY was in a consistent descending trend that sellers during this descending trend were successful in achieving the lowest price level of 100.763.According to the recent downfall, in weekly and daily time frames price is under 5-day moving average and warns about more descending during the next candles.As it is obvious in the picture below, there is a harmonic butterfly pattern between the bottom price of 95.818 and the top price of 105.421 that there is a potential for changing price direction from D point of this pattern.

RSI indicator is in saturation sell area and divergence mode with the price chart that confirms the current bottom price and warns about descending of price during the next candles.Price is going toward the support level of 101.320 (the important psychic level of Sellers) and there is not any clear reason of buy signal in long term time frames such as daily and weekly.Generally until the top price of 104.138 is preserved, there is a potential for descending and price reformation in this currency pair.


2014.05.06.png
 

PipSafe

Новичок форума
USD/CHF during the recent Days was in a strong and consistent Downtrend that sellers were successful in achieving the lowest price of 0.87202.Price during the downfall with reaching to the Fibonacci level of 161.8 ABC pattern has stopped from more descend and has formed a bottom price in the level of 0.87202.Currently in H4 AND H1 time frames price is above 5-day moving average that warns about the potential of ascending of price during short period of time.

AS it is obvious in the picture below, there is an ideal AB=CD harmonic pattern between the top price of 0.86610 and the bottom price of 0.87202 with ratios of 78.6 and 161.8 (also formation of butterfly pattern in CD wave), that warns the ascending of price from the D point.RSI indicator is in saturation Sell area and confirms the current bottom price, also wars about formation of a bottom price.Generally until the price level of 0.87202(D Point)is preserved, price will have the potential for reformation and ascending.


Technical Analysis of USD/CHF dated 2014.05.07

usdchf-news-2014.05.07.png
 

PipSafe

Новичок форума
CAD/CHF form 2012 till now was in a strong and coherent descending trend that sellers strictly followed their descending price targets. Price during the recent downtrend was able to record the bottom price of 0.78000 and it is fixed by the ascending candles. The mentioned bottom price is One of the lowest price in the history of this currency pair and generally the price is in a saturation sell area. As it is obvious in the picture below, price during the descending has touched the lower median line and also the round supportive level of 0.78000 and has created the Spining Top candlestick pattern. Closing of the bullish candle(Engulfing pattern) after this pattern will confirm it and warns about ascending of price.

Also In monthly time frame of this currency pair, there is a non-ideal hammer candle stick pattern that warns about the potential for formation of a bottom price and ascending of the price for buyers.RSI indicator in weekly and Monthly time frame is in saturation sell area and with the next cycle confirms the current bottom price and warns about the potential of ascending during the next candles. Generally according to the formed signs in this price chart, until the bottom price of 0.78000 is preserved, there will be the potential for ascending and price reformation in this currency pair.

Technical analysis of CAD/CHF dated 2015.05.08
cadchfweekly.png
 

PipSafe

Новичок форума
GBP/USD had an ascending trend without a noticeable reformation during the recent weeks that shows buyer certainty in reaching to the predetermined targets. The price could record the top price of 1.70000 in Weekly time frame which is fixed by descending candle(Shooting Star Pattern).The price by reaching to the resistance Up Channel edge and also the round resistance level of 1.70000 (buyers use these levels to exit their trades) has been stopped from more ascend and by forming a Harami candlestick patterns( possibility of formation of a top price and changing price direction)and fixing of it by a descending candle has prepared the field for creating a top price and a descending trend.

Currently price is under 5-day moving average in daily and 4H time frames that warns about descending of price during the next candles.As it is obvious in the picture below, there is an AB=CD harmonic pattern between the bottom price of 1.62491 and the top price of 1.70000 with none-ideal ratios of 61.8 to 127.2 that warns about descending of price from the D point of this pattern.As it is obvious in the picture bellow, according to the formed movements, the price is in divergence mode with Stoch indicator and confirms the mentioned top price is Daily time frame which generally warns the possibility of changing price direction.Generally until the price level of 1.70000 is preserved, price will have the potential for reformation and descending.

Technical Analysis of GBP/USD dated 2014.05.13

gbpusddaily.png
 
Статус
Закрыто для дальнейших ответов.
Верх